Kareo and PatientPop are now Tebra. Becoming Tebra will take time and we appreciate your patience as we transition to the new brand experience.Learn More
Tebra Help Center

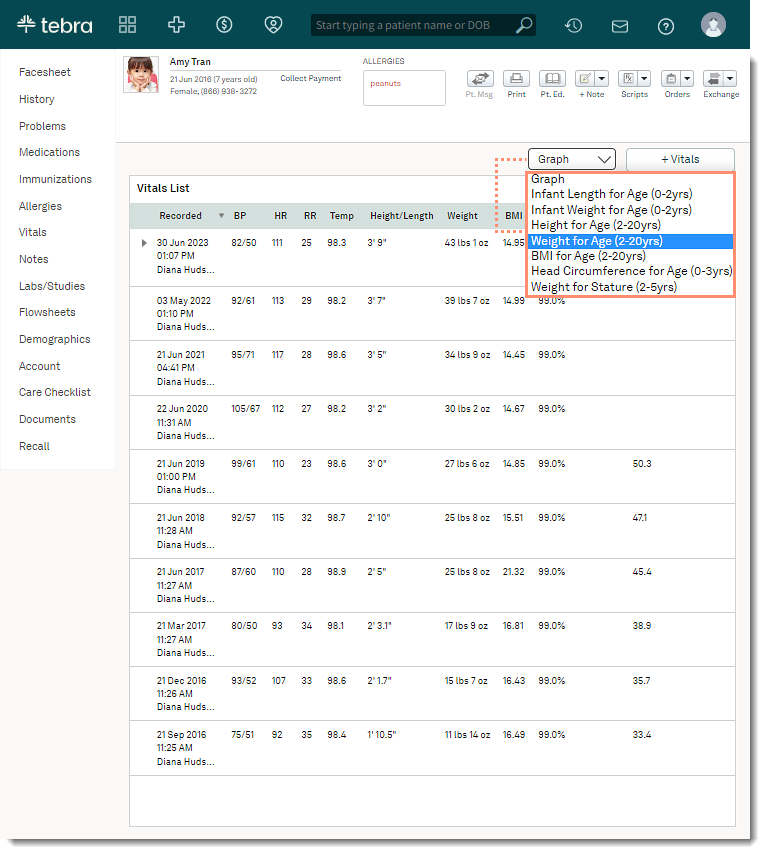
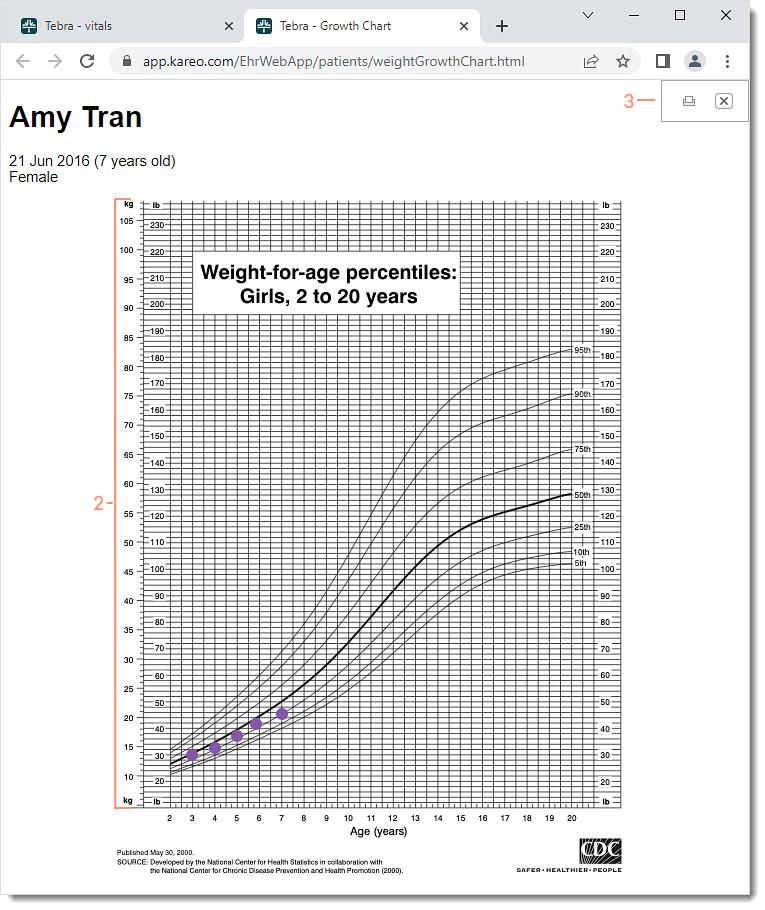
Graph Length, Weight, Head Circumference

Updated: 03/18/2024|Views: 2056

A graph of plot growth charts for patients ages 0-20 can easily be generated from the patient's recorded vitals.

Access Patient Vitals

  1. Enter the first 2–3 letters of the patient's name or date of birth (mm/dd/yyyy) in the top navigation bar search box.
  2. Click to select the patient from the auto-populated results. The patient's Facesheet page opens.
  3. Click Vitals. The Vitals page opens.
Clinical_Vitals_Access.png

View Graph

Vitals must be recorded first for the vitals to be plotted on the graph.

  1. Click the Graph drop-down arrow and select a graph to generate. The graph opens in a new browser. Available graphs vary based on the patient's age:
    • Graphs available for patients under the age of 2: Infant Length for Age (0-2 years), Infant Weight for Age (0-2 years), and Head Circumference for age (0-3 years).
    • Graphs available for patients between the age of 2 and 5: Height for Age (2-20 years), Weight for Age (2-20 years), BMI for Age (2-20 years), and Weight for Stature (2-5 years).
    • Graphs available for patients between the age of 2 through 20: Height for Age (2-20 years), Weight for Age (2-20 years), and BMI for Age (2-20 years).
Clinical_Vitals_Graph.png
  1. The patient's relevant recorded vitals are plotted on the graph with red dots.
  2. To print the graph, click the printer icon. Then, use the web browser's printer function to generate a paper copy of the graph.
Clinical_Vitals_GraphPrint.png
  • Was this article helpful?