Navigate Quality Measures Dashboard
- Last updated
-
-
Save as PDF
Updated: 04/04/2024 | Views: 1754
Tebra’s Quality Measures Dashboard enhances quality measure reporting to ensure electronic quality measure (eCQM) reporting is intuitive and optimized for maximum reimbursement. Providers can clearly assess quality measure performance, view industry benchmarks, and drill into patient details.
Note:
- The Quality Measures Dashboard automatically ends the session after 15 minutes of inactivity and queued reports continue to generate if the session ends.
- When users are done running or viewing reports, logout of the Quality Measures Dashboard to end the session. Or, log out of Tebra to end both sessions.
Access Quality Measures Dashboard
- Hover over the Clinical icon and click on Quality Measures. The Quality Measures page opens.
- Click to learn more about the measure and determine eligibility.
- Click Open Quality Measure Report. The Quality Measures Dashboard page opens in a new browser.
- To activate the Quality Measures Dashboard, click Request More Information. Tebra will reach out shortly to gather details for activation.
|
 |
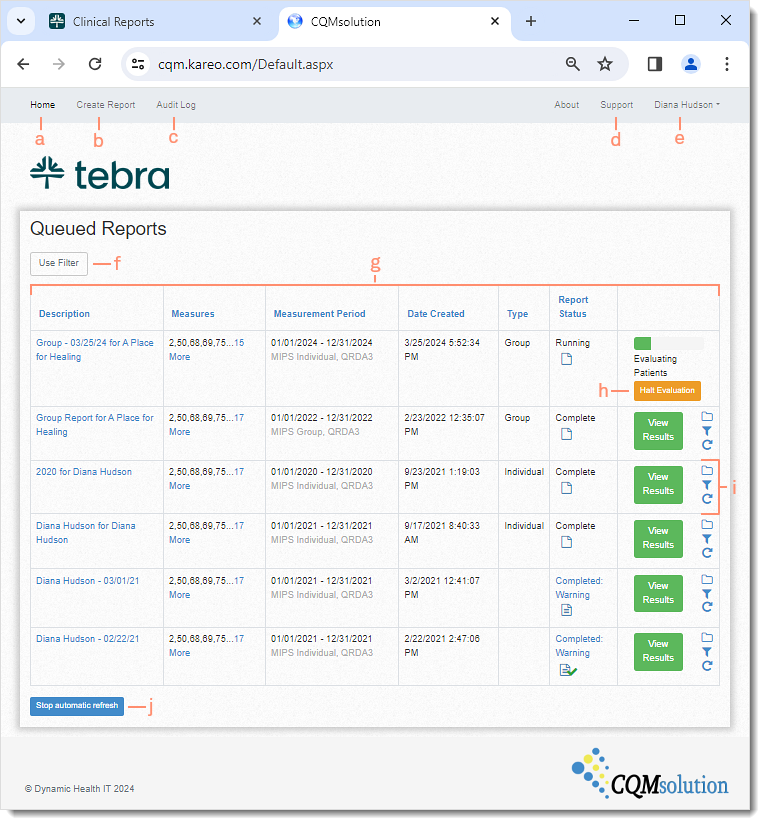
Navigate Quality Measures Dashboard
- Home: Click to navigate back to the Quality Measures Dashboard.
- Create Report: Click to initiate quality measure reports.
- Audit Log: Click to view record logs of the following actions: account log in/log out, patient data was added for report, report was archived, QRDA-III was downloaded, which user initiated a report, and when a report was halted.
- Support: Click to view documents for Quality Measures supported by Tebra.
- User: Displays the name of the provider or system administrator logged in.
- Use Filter: Click to filter reports by Report Id, Description, Status, User Name, Practice Name, Submission Comment, Begin Date, or End Date.
- Report Headers: View Quality Measure Reports listed in reverse chronological order. Practice Administrator sees all reports and providers only see their reports.
- Description: Click to view the Report ID.
- Measures: Displays quality measures selected for the report. Click More to view all quality measures.
- Measurement Period: Start and end dates of the report.
- Date Created: When the report was initiated.
- Report Status: Displays the report status. Click on the status to view additional details or click on the notepad icon to notate report submission or notes.
 Tip: If the report status indicates a problem has occurred, contact Customer Care for further assistance. Tip: If the report status indicates a problem has occurred, contact Customer Care for further assistance.
- Running: The report is processing.
- Complete: The report calculation is completed and processing errors were not detected.
Note: Use reports with the status of Complete to generate a QRDA III file for attestation.
- Completed: Warning: The report calculation is completed and elements may be missing.
- Complete with Errors: The report calculation is completed and contains processing errors.
- Halted: The halt evaluation button was clicked and stopped the report from running.
- Failed: Report cannot evaluate any patients due to an error or lack of data.
- Halt Evaluation: Displays when a report is initiated and is running. Click to permanently stop the report from running.
- View Results: Click to view the quality measure report.
- Archive: Click the folder icon to remove the report from the Quality Measures Dashboard and delete the associated items.
- Filter: Click the filter icon to filter the data in the report.
- Rerun: Click the icon to generate a new report with identical parameters.
Note: Tebra only saves 3 of the most recent version of the rerun report.
- Automatic Refresh: When active, the page refreshes every second.
|
 |