Reporting Dashboard
The Reporting Dashboard provides you with important information to assist you in evaluating the performance of your practice. Displayed are key indicators for accounts receivables, claim accuracy, claim rejections and denials, and claim processing. Use these indicators to maintain a healthy practice by monitoring trends and updating your workflow processes as necessary.
Note: In order to view the Reporting Dashboard you must have permission to view the A/R Aging Summary report (see section New User Account).
![]() To access the reporting dashboard
To access the reporting dashboard
-
Click Reports > Key Indicator Reports > Reporting Dashboard.
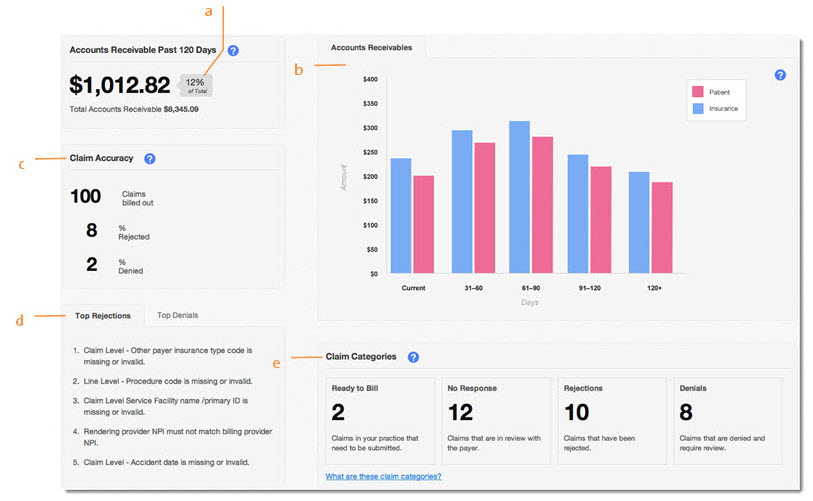
- Accounts Receivable Past 120 Days: Updated daily. This metric enables you to evaluate your practice’s payment collection and write-off process. Keeping this metric low is essential for a healthy practice, therefore, a practice should set a goal to maintain this number at a certain percentage of its total accounts receivables; the industry best practice suggests a percentage in the 10-15% range. While it is common for payments to take more than a couple of months, watch for factors that can contribute to delays in payment (e.g. incorrect patient insurance information, irregular claim submission and payers needing time to review claims). Note that the receivables do not include refunds and capitated amounts.
- Accounts Receivables Chart: Updated daily. This chart provides a visual presentation of your accounts receivables. At a glance, you can easily review the distribution of your accounts receivables in a dollar amount by patient, insurance and aging. Note that the receivables do not include refunds and capitated amounts.
- Claim Accuracy: Updated daily and includes information for the past 30 days. This displays the total number of claims billed in the last 30 days; also shown is the percentage of those claims that have been rejected or denied, enabling you to evaluate the accuracy of your claims. Rejections include those from the clearinghouse and payer. Denials count the number of payment posts that are associated with zero dollar payments and denial codes.
- Top Rejections and Denials: Updated daily and includes information for the past 30 days. Designed to complement the rejection and denial rates, click on a tab to view an aggregate of the most common rejections and denials received in your practice. These messages enable your practice to spot claim rejection/denial trends, thereby giving you important information to determine fixes or implement new processes. For example, if you often receive rejection messages indicating incorrect patient insurance information, your practice may want to reevaluate how you obtain and confirm that information.
- Claim Categories: Updated in real time. This section gives you a clear view of the claims that require attention from the staff who perform these tasks. Clicking on a category will direct you to the claim window filtered to that category. A practice should set a goal to keep these numbers low. If they are too high:
- Denials - Investigate why claims are being denied and determine if you should appeal.
- Rejections - Make edits to claims and re-bill. Use the Claim Accuracy metric and Top Rejections messages to help you monitor your overall trend.
- No Response - Determine which payers often take longer to provide you a response; call them to understand what you can do to accelerate the process.
- Ready to Bill - Determine what is stopping your staff from billing claims on a daily basis.